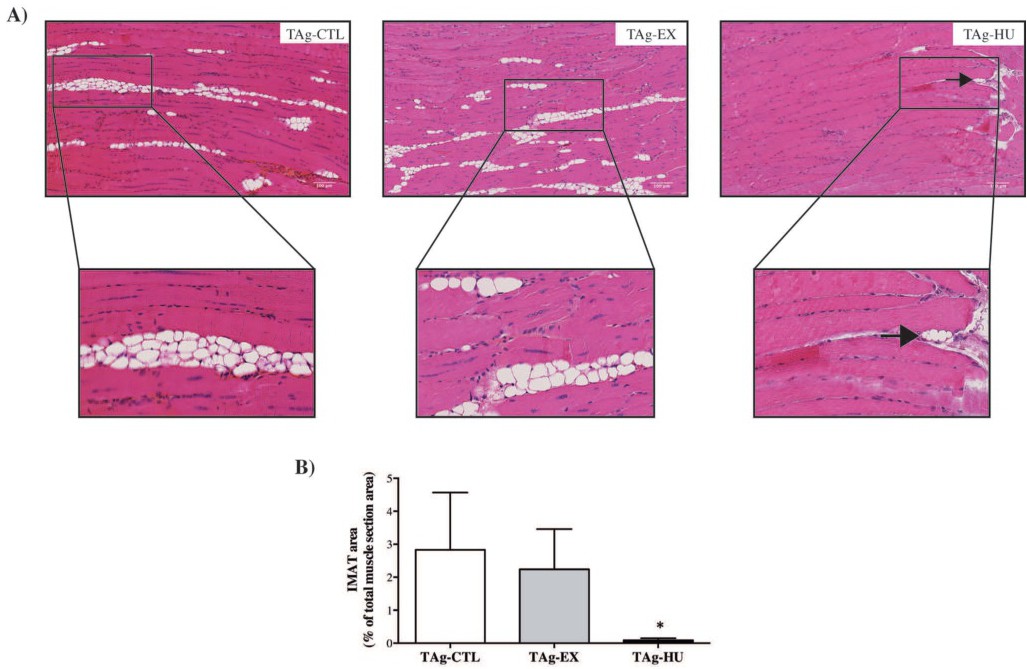
Fig. 1. Effect of different muscle activity levels on IMAT accumulation. A) Representative longitudinal paraffin-embedded muscle sections, stained with hematoxylin-eosin-saffron, from TAg of each experimental group (CTL, EX and HU), 21 days after glycerol muscle injury (N=6). Images of TAg-CTL and TAg-HU are re-used from Brioche, et al. [5] and Pagano, et al. [25] respectively. B) Quantification of intermuscular adipose tissue (IMAT) area in percentage of total muscle section area from TAg of each experimental group (CTL, EX and HU), 21 days after glycerol muscle injury (N=6). One-way ANOVA was used to compare our experimental groups, * p<0.05 vs. TAg-CTL